Dashboards can support any number of charts with a dynamic layout to view all the information you need.
Create a dashboard
-
Navigate to the Dashboards tab, or click + New from the tab bar and select 'Dashboard'.
-
Give your dashboard a name and click 'Save'.
-
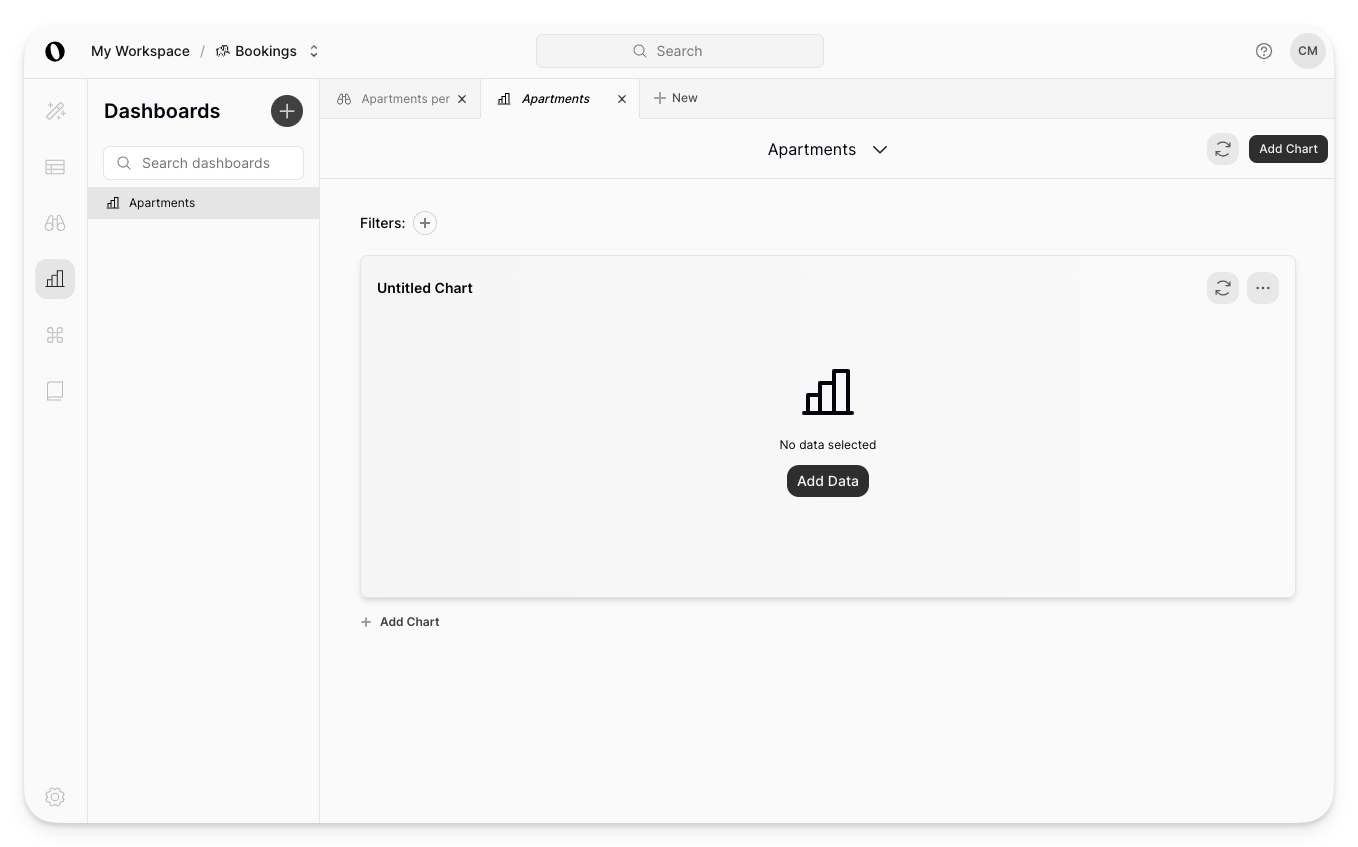
Click 'Add Chart' in the top right hand corner.
-
An empty chart will be added to your dashboard. Click 'Add Data'.
-
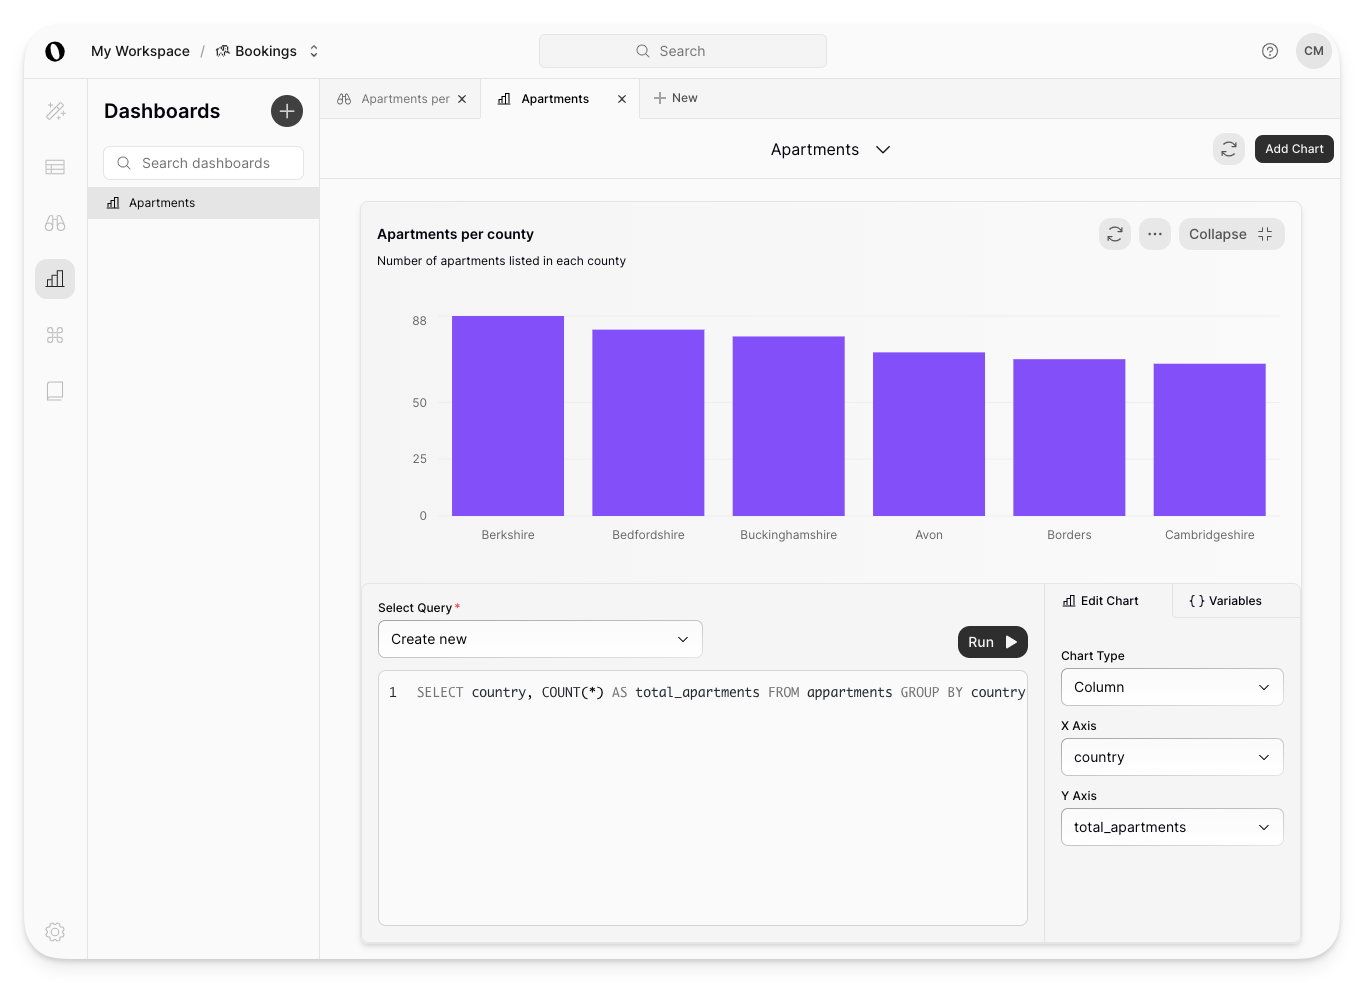
Select from your saved queries or write a new query and run it. Check your chart type and X and Y axis selection are as you would like them. You can also update the chart name and add a description.
-
Save the changes to your dashboard and collapse the chart edit mode.
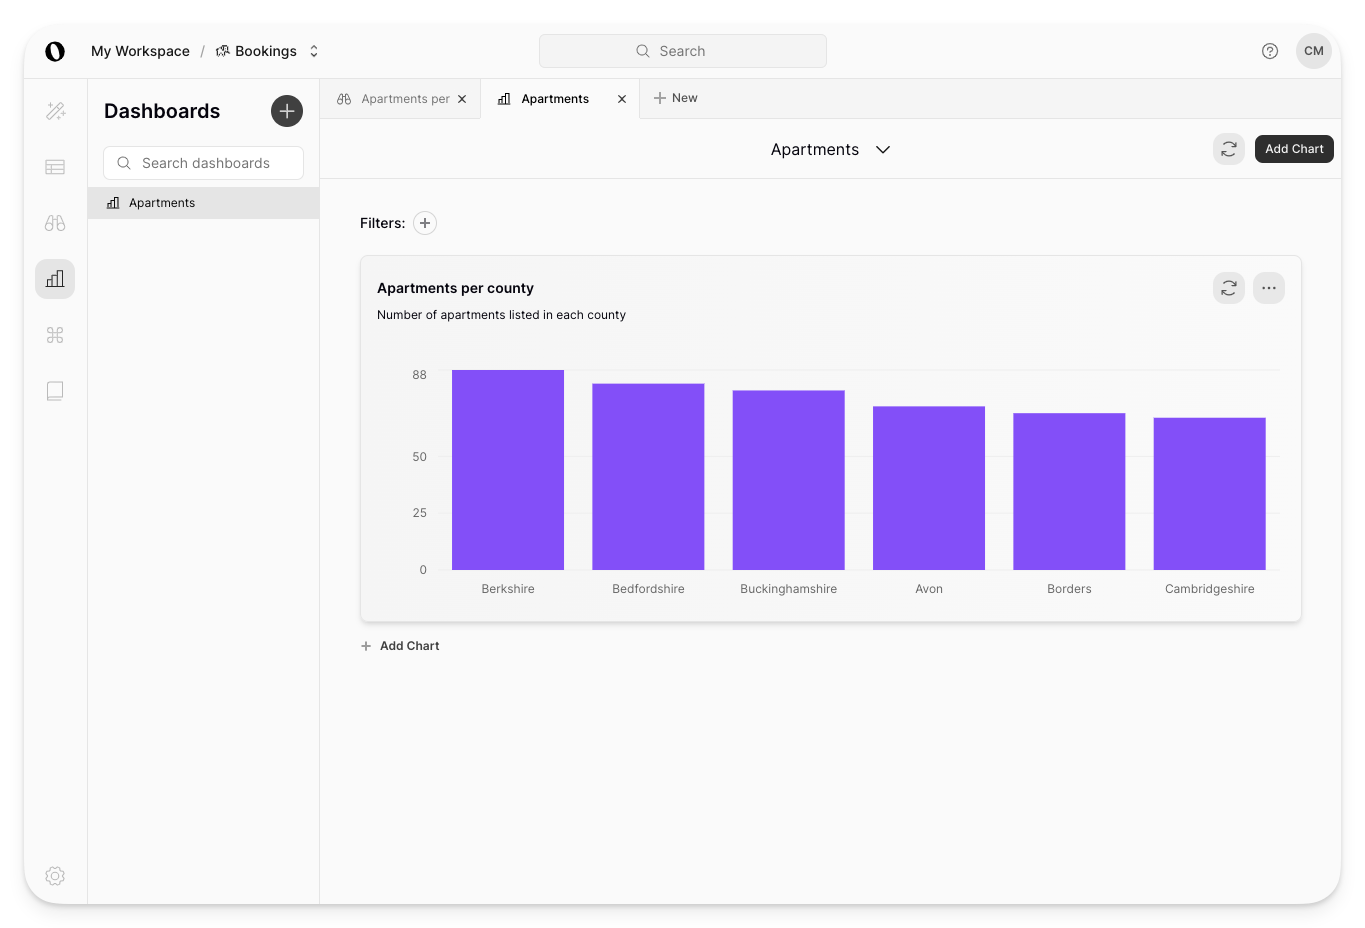
Continue to add as many charts to the dashboard as you need to.
Export options
Outerbase makes it easy to share information with who needs to see it, in the format you need.
Export results as a CSV
-
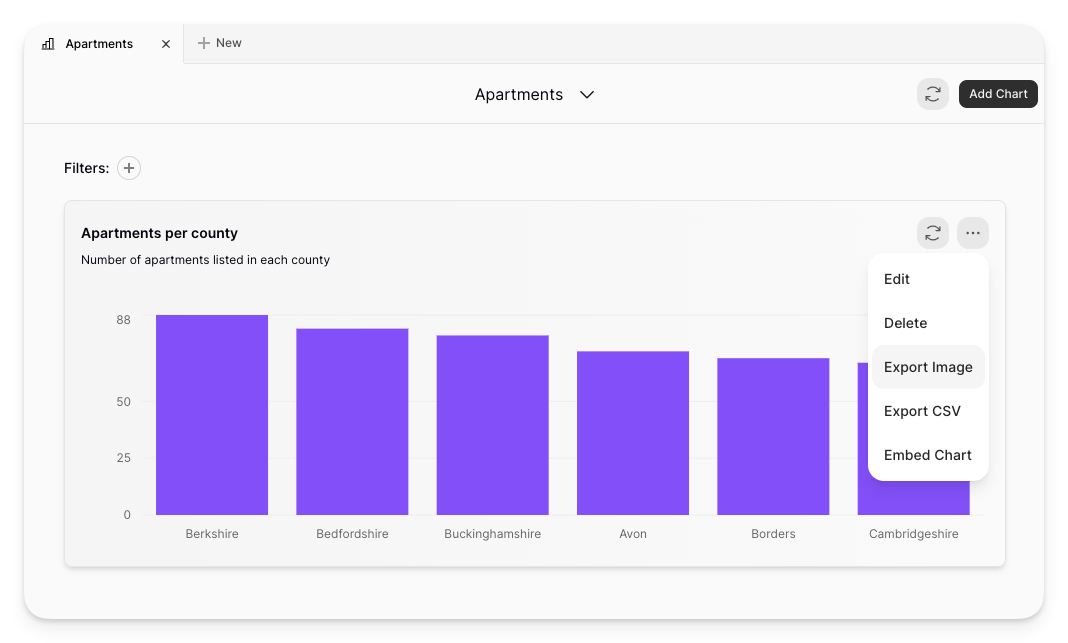
Open the ... menu and select 'Export Results'.
-
A CSV download of your results will start.
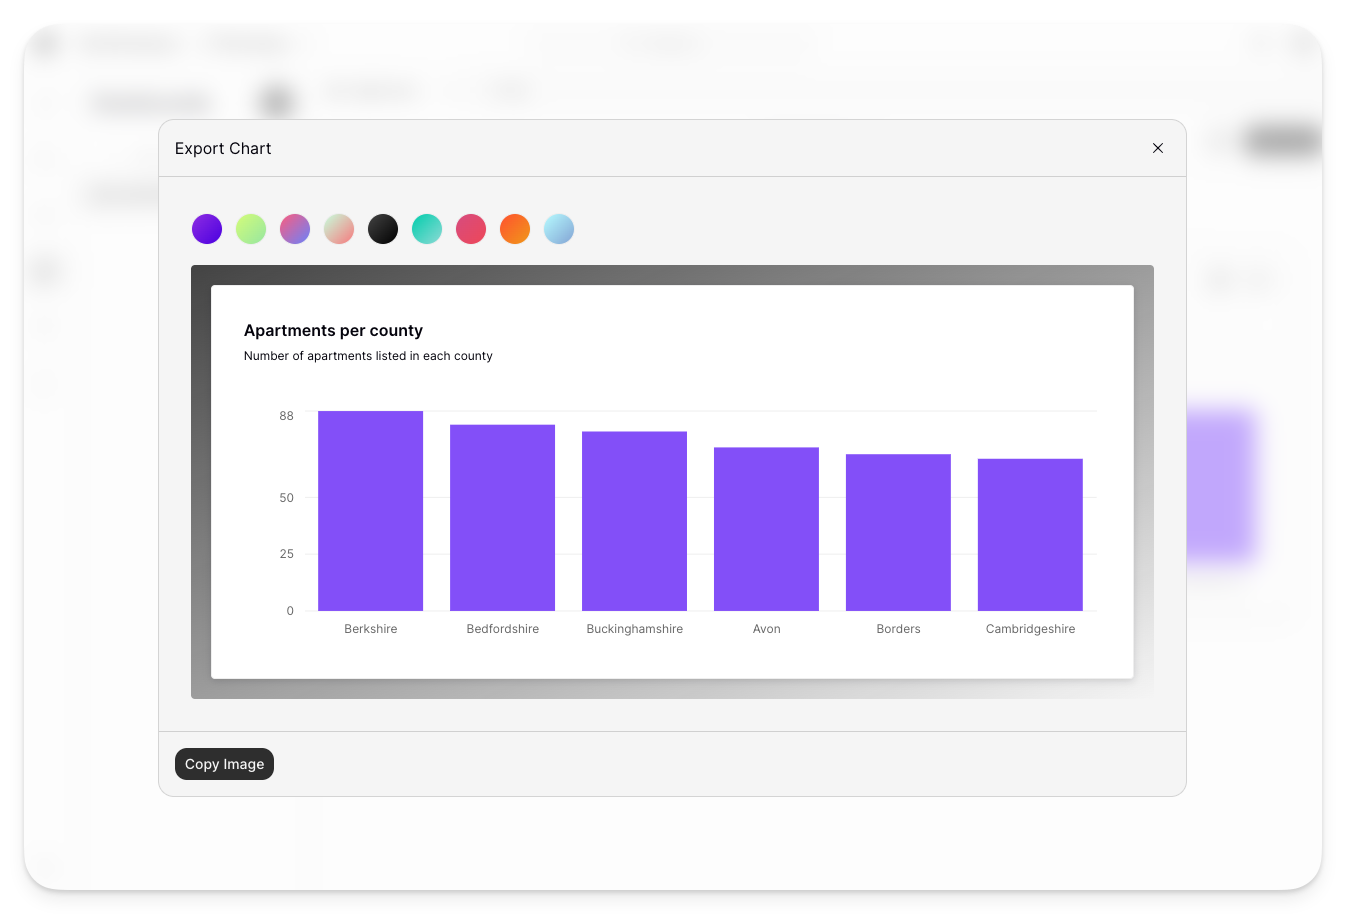
Export chart as image
-
Open the ... menu and select 'Export Image'.
-
Select your preferred visual style.
-
Click 'Copy Image' to copy the image to your clipboard.
Embedding charts
Once you have added a chart to a dashboard, you can embed that chart wherever you want with the click of a button. Learn how to embed a chart