Understanding your data while looking at raw output can be difficult. With Outerbase you can convert your raw data into visuals in seconds, making it easier for you and your team to gleen insights quickly.
Create a chart from the query editor
When you run a query, you can switch tabs to easily convert your results into a chart.
-
Run your query in the query editor.

-
Once your results are displayed, switch to the Create a chart tab (still within the query editor).
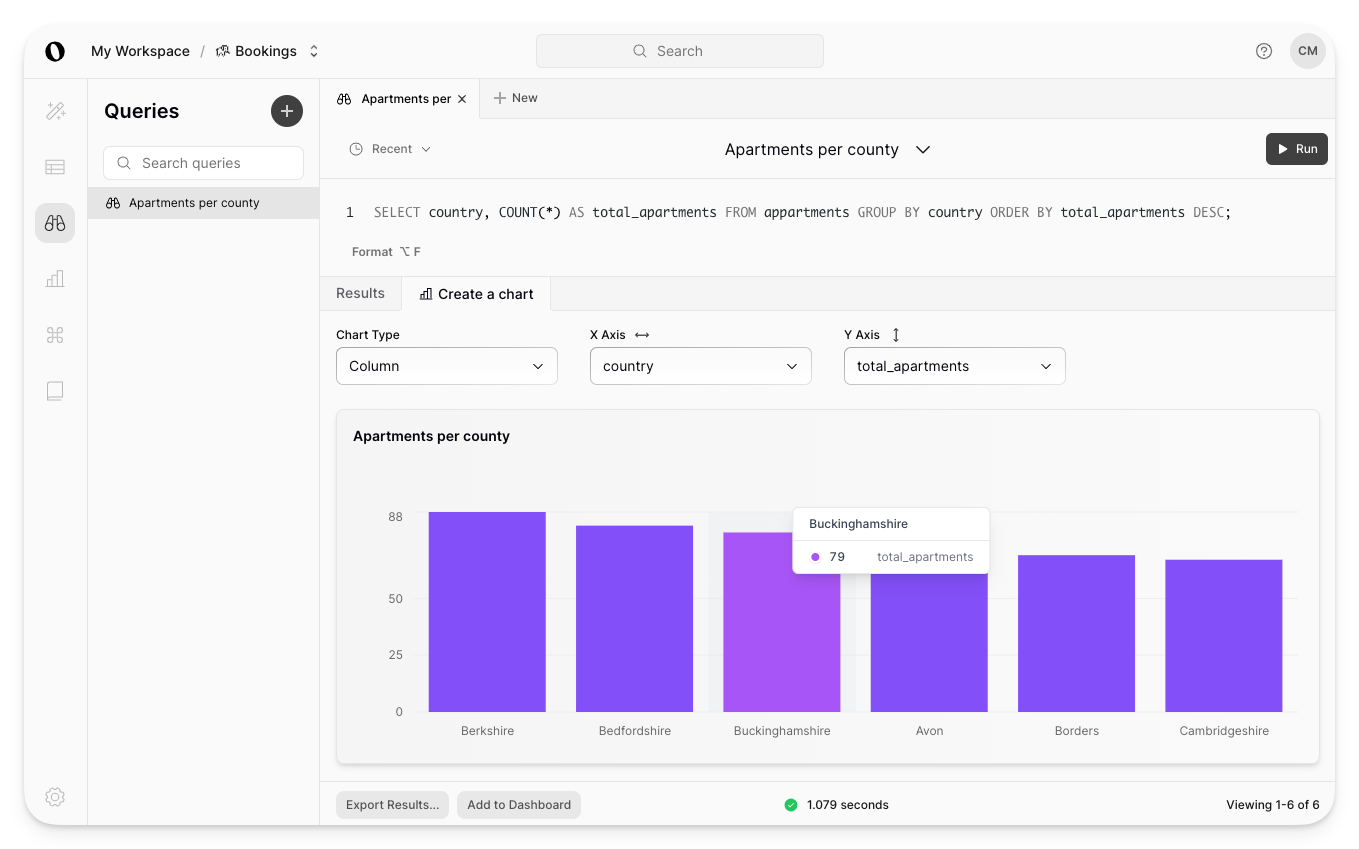
From the Create a chart tab, you can modify the chart type and X or Y axis selection. You can also export the chart as an image or add it to a dashboard.